Title: Korean Reference Genome construction by next generation sequencer: full genome sequencing for ethnic groups is necessary.
1. Abstract
The first full Korean individual genome sequence is made publically available. This genome will be used as the basis for building Korean Reference Genome for ethnic Korean population which represent over 100 million individuals posessing a distinct language and culture. By January 2009, 300 giga bases of a male Korean genome was sequenced by Solexa genome analyzer. It resulted in 20 fold redundancy and covers 99.9% of the NCBI reference genome. The overall accuracies in terms of XXX and YY are ZZZ and KKK. Three million new SNP candidates that were specific to Koreans were found. This high number of new SNPs justifies that each ethnic group requires its own genome sequencing project to generate its own reference genome. Although the previously reported Chinese genome is very similar to the Korean one, but there were significant differences between the two very close ethnic groups if these two individuals are supposed to represent the population. They were different in SNP and copy number variations (CNV). The SNP chip analyses carried out alongside the genome sequencing showed that Koreans lay in between Chinese and Japanese populations. Mitochondrial sequence analyses from the Korean genome revealed that there was a significant variations showing the heterogeneous mitochodrial genome composition.The massive data generated by next generation sequencing technology takes us one step closer to personalized genomic medicines.
2. Introduction
In 1977, the first full viral genome sequence was published by Sanger et al., in MRC Centre Cambridge, UK and three years later Anderson et al., sequenced the complete human mitochondrial genome. Both the genomes had exact number of bases, 5,386 and 16,569 respectively, and exact number of coding genes have been verified. Now, researchers know the exact functions of DNA fragments in these genomes. These key projects laid the foundation for sequencing the full human genome which was completed in 2003.At present , there are at least four completely sequenced individual human genomes published. Among them, Craig Venter's genome has the highest quality and can be used as a reference genome for future individual genome projects. However, producing such a high quality genome is still extremely expensive.
Apart from the NCBI's reference genome that was sequenced over the last decade, it is still not clear how useful the analyses are by sequencing individual human genomes as national and global projects. NCBI's reference genome has an importance as the candidate human reference standards that can be compared to all the human genomes that will be sequenced in the future. It is an important question for government to understand how extensively the personal genome sequencing should be done. Relatively cheap SNP genotyping is already well introduced to the public. Compared to such cheaper and simpler chip based genotyping, what merits can full genome sequencing can bring to the society? Another point to consider is that, unlike the first viral and mitochondrial genomes , understanding the exact functions of all the human genetic elements is still a difficult task even if we acquire the full human sequences. Surprisingly, researchers still cannot count the exact number of human genes after decades of sequencing let alone the exact number of proteins expressed in a cell. Yet, due to the advancement of fast next generation sequencing technologies, more number of full genome sequencing projects are arriving; 1000 genome project, xxxxxxx, xxxx, xxxx, and xxxx. What is the practical benefit for a society to perform such a national scale full human genome sequencing? Here, we present some justification on why distinct ethnic groups need to perform their own human genome sequencing. We found that a Korean genome has significantly different number of SNPs to the already published Chinese genome while these two ethnic groups are known to be very close. We think that the difference is large enough to produce independent Korean reference genome that can be utilized for future personal genome projects in Korea.
3. Results
3.1 Data Summary
|
|
GAP
|
Reads
|
Nucleotides
|
Genome Coverage
|
Depth
|
Genome Coverage / Total NTs
|
|
36b-PE
|
80 base
|
xxx
|
xxx
|
|
|
|
|
36b-PE
|
300 base
|
xxx
|
xxx
|
|
|
|
|
75b-PE
|
180 base
|
xxx
|
xxx
|
|
|
|
|
Total
|
xxx
|
xxx
|
|
|
|
3. Nucleotide composition – GC contents (consensus)
|
A
|
C
|
G
|
T
|
|
|
Reference
|
29.53%
|
20.44%
|
20.46%
|
29.57%
|
|
KSJ
|
28.13%
|
21.82%
|
21.79%
|
28.26%
|
-
4. Sequencing quality
- High quality: 80% - African (~60%) 보다 높고, YH (81%)와 비슷한 수준
*각 nucleotide의 Q threshold를 20으로 했을때, (#NT above 20)/(#total NT) * 100 (%)
5. Mapping status of each chromosome : 데이터가 더 나오면 depth가 더 깊어질 것임
6. Sequencing quality distribution : high quality
* G-banded Karyotype
* Phylogeny Analysis
Linage of Y, mtDNA, and autosomes
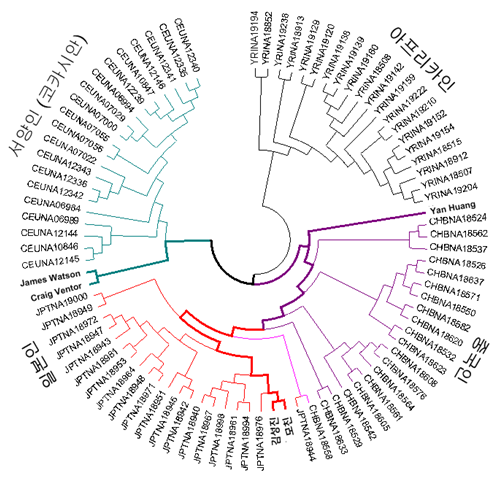
To identify the paternal and maternal linage of a Korean genome, Y, mtDNA, and autosomes were traced separately. When compared with Y Chromosome Consortium haplogroup markers (Karafet et al, 2008), the KoRef donor Y chromosome had variations which are known as the markers of a sub-haplogroup "O2b"(Fig X). The O2b sub-haplogroup is of high frequency in the Korean and Japanese populations, and is a sub group of O haplogroup who probably originated in East Asia and later migrated into the South Pacific. The mtDNA haplotype suggested XXXXX (Fig. X). The autosomal linage was similar(or different, or similar to Y chromosome, or only similar to mtDNA) to XXX and a Korean donor was located between CHB and JPT (Fig. X).
Fig. X. Y chromosomal linage of the Korean genome
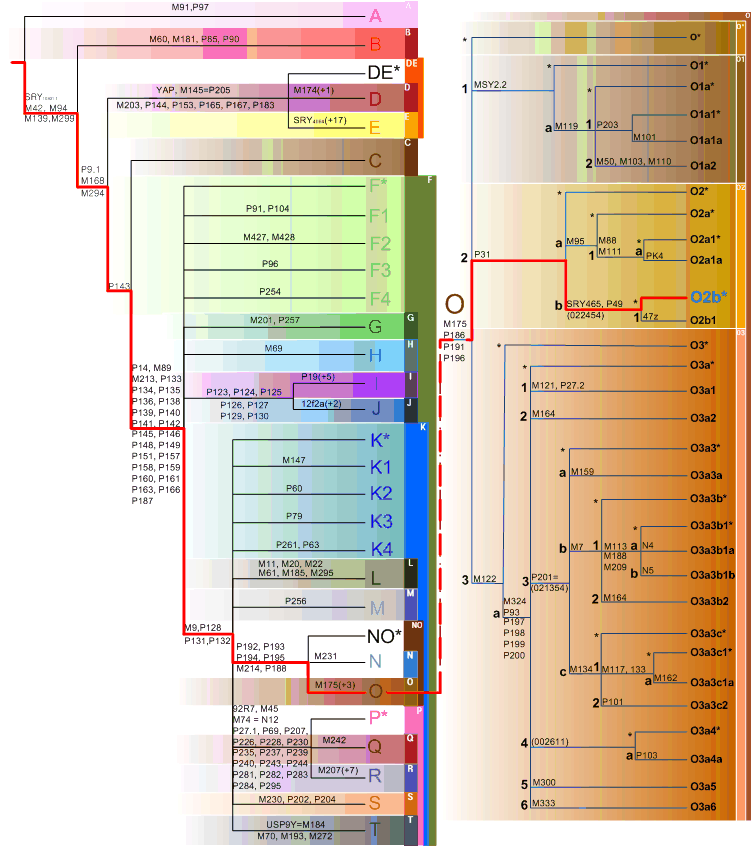
Fig. X. Autosomal linage of the Korean genome
* Haplotype Analysis
Inferred Korean donor’s haplotypes showed more inconsistency to HapMap haplotypes than Chinese’ ones as much as XX%. Korean donor’s genome has possible haplotype breakpoints against to the haplotypes of HapMap CHB/JPT samples as much as xxx number when it was phased with mother’s genotype.
* Donor pedigree
3.3 Alignment Results
3.4 Genetic Variations
3.4.1 SNPs
Table X. Characterization of SNPs detected in the KSJ genome compared with dbSNP database (UCSC build 129). The dbSNP alleles presented as validated and non-validated SNPs, and the novel SNPs meant non-present SNPs in dbSNP database
|
|
N. of SNPs |
Homo |
Hetero |
|
Total |
2,474,648 |
700,969 |
1,773,679 |
|
dbSNP |
1,574,921 |
|
|
|
validated |
1,364,868 |
635,843 |
729,025 |
|
non-validated |
210,053 |
48,659 |
161,394 |
|
5'UTR |
3,513 |
|
|
|
3'UTR |
15,771 |
|
|
|
CDS-Syn |
10,414 |
|
|
|
CDS-Nonsyn |
5,357 |
|
|
|
Novel |
899,727 |
16,467 |
883,260 |
|
5'UTR |
2,381 |
|
|
|
3'UTR |
10,920 |
|
|
|
CDS-Syn |
1,448 |
|
|
|
CDS-Nonsyn |
9,472 |
|
|
Figure X. Characterization of SNPs detected in the KSJ genome compared with dbSNP database (UCSC build 129). 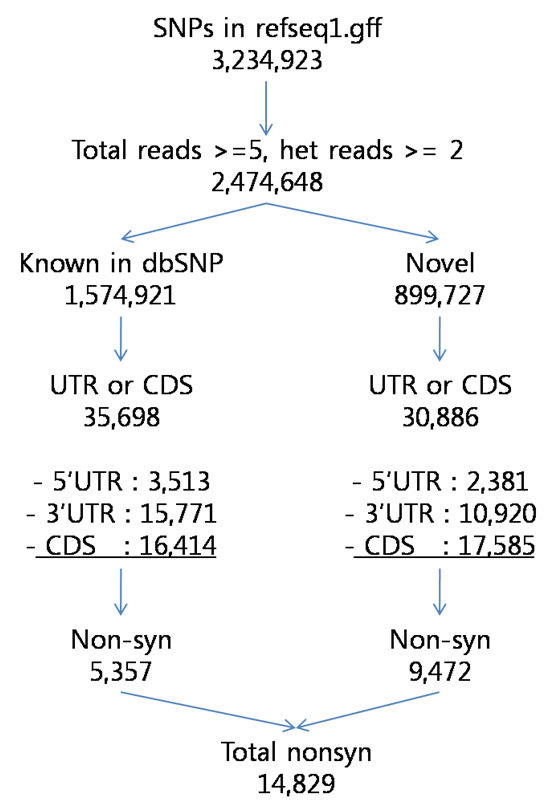
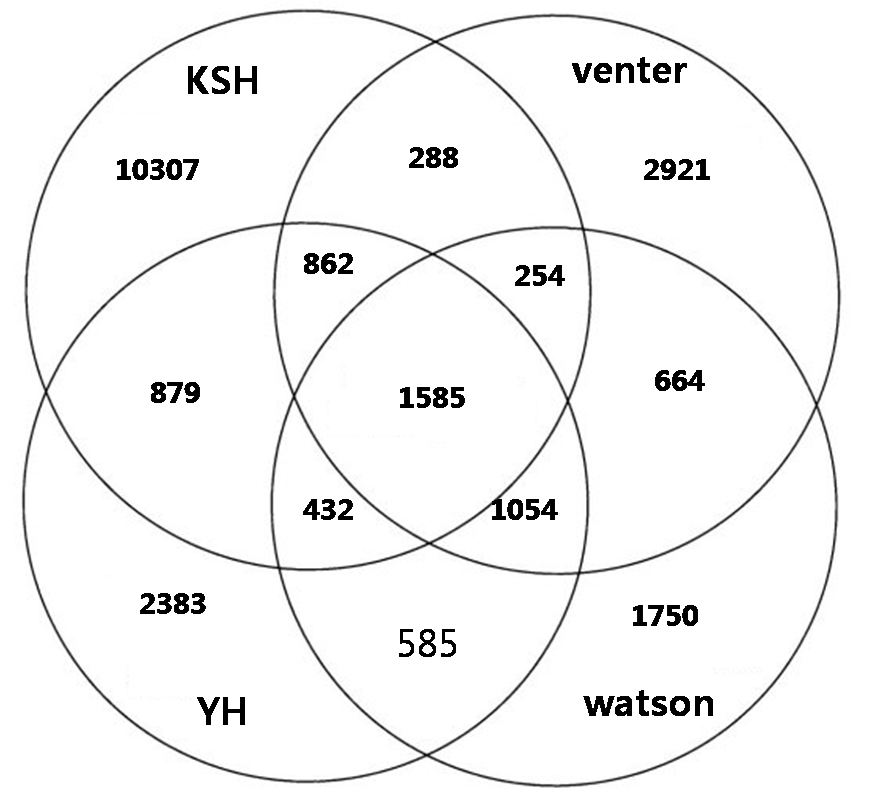
In individual genome comparision, we compared with three different individual genome sequences such as venter, watson, and YH chaina genome In looking at the SNPs of the four individual genomes, XXX SNPs are all shared, and each also has a set of SNPs unique to their own genome: for KSJ, xxx SNPs, for YH xxx SNPs; for Venter, XXX ; and for Watson, XXX
Figure. Comparision and overlap of SNPs of KSJ genome and other genomes. Watson, Venter, and BGI YH.
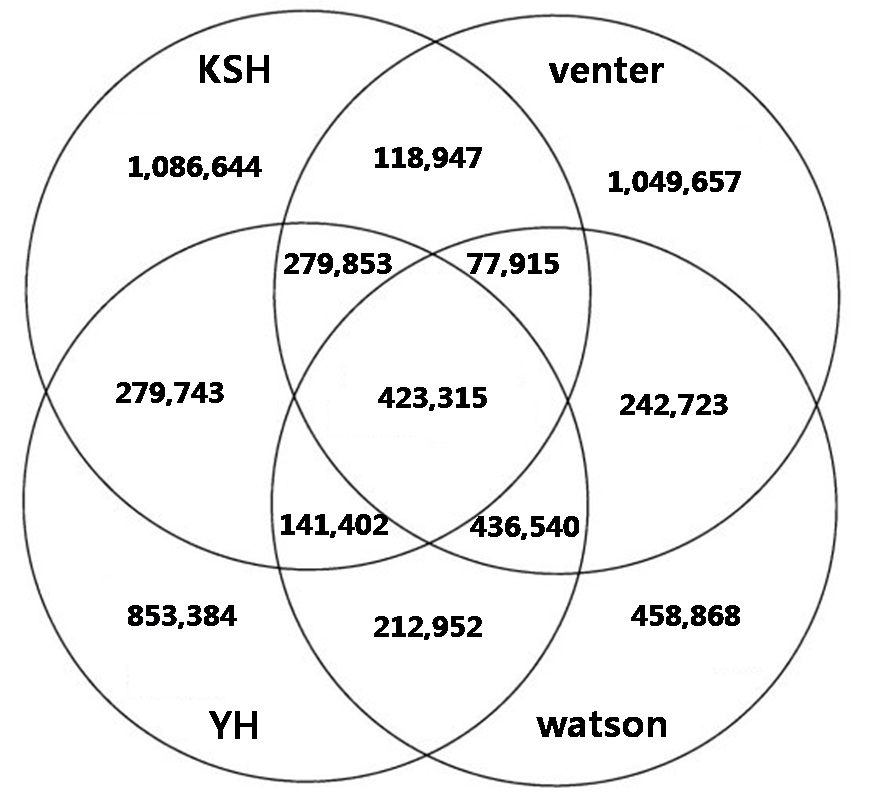
Figure. Comparision and overlap of nonsyn-SNPs of KSJ genome and other genomes. Watson, Venter, and BGI YH.
We compared the non-synonymous SNPs of four individual genomes. As a result, XXX non-synonymous SNPs are all shared among the four individuals, xxx
.jpg)
Fig X. Comparison of Genome sequencing and Affy 6.0 genotyping alleles
3.4.2 Indels
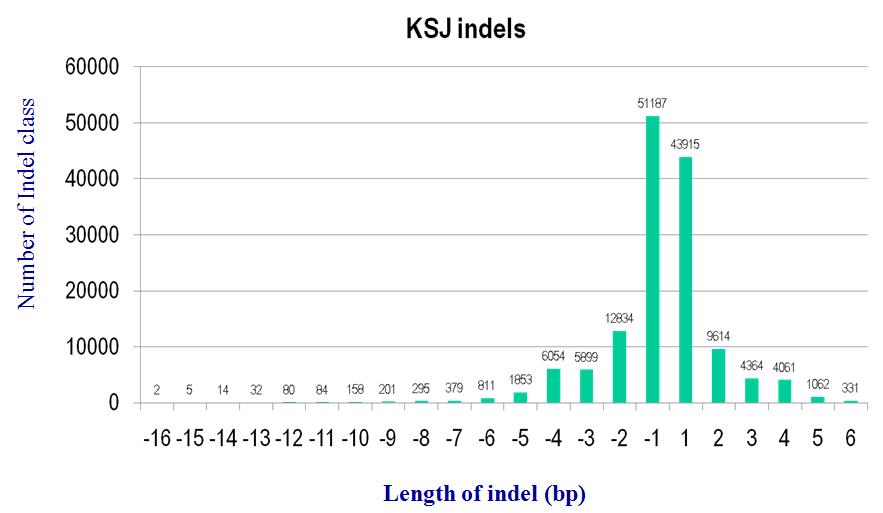
Fig x. Distribution of indel size
Table X. Total number of calls and fraction that match previous small Indels in dbSNP
|
|
Total |
dbSNP |
dbSNP (%) |
||||
|
|
|
Validated |
Un- validated |
Novel |
Validated |
Un-validated |
Novel |
|
All Indel |
143235 |
167 |
54864 |
88204 |
0.12 |
38.30
|
61.58 |
|
Hetero Indel |
61019 |
74 |
18977 |
41968 |
0.12 |
31.10 |
68.78 |
|
Homo Indel |
82216 |
93 |
35887 |
46236 |
0.11 |
43.65 |
56.24 |
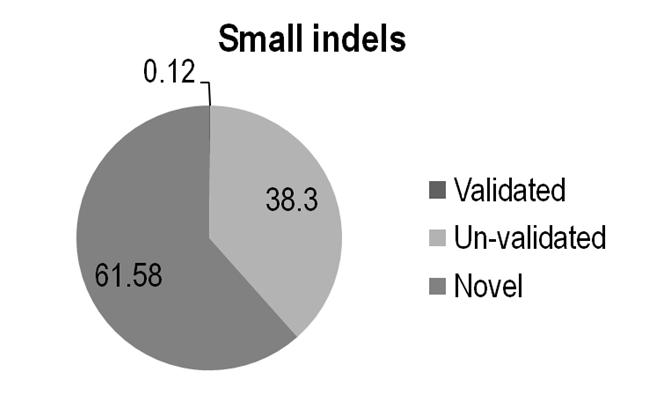
Fig x. Rate of indel calls mathced by dbSNP
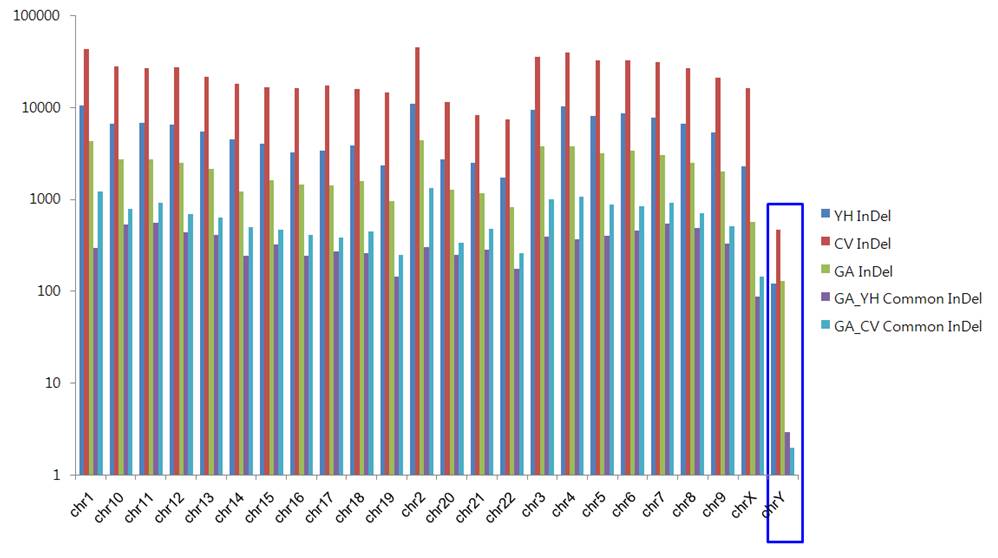 Figure xxx. Common InDels in GA,HY,CV Genome
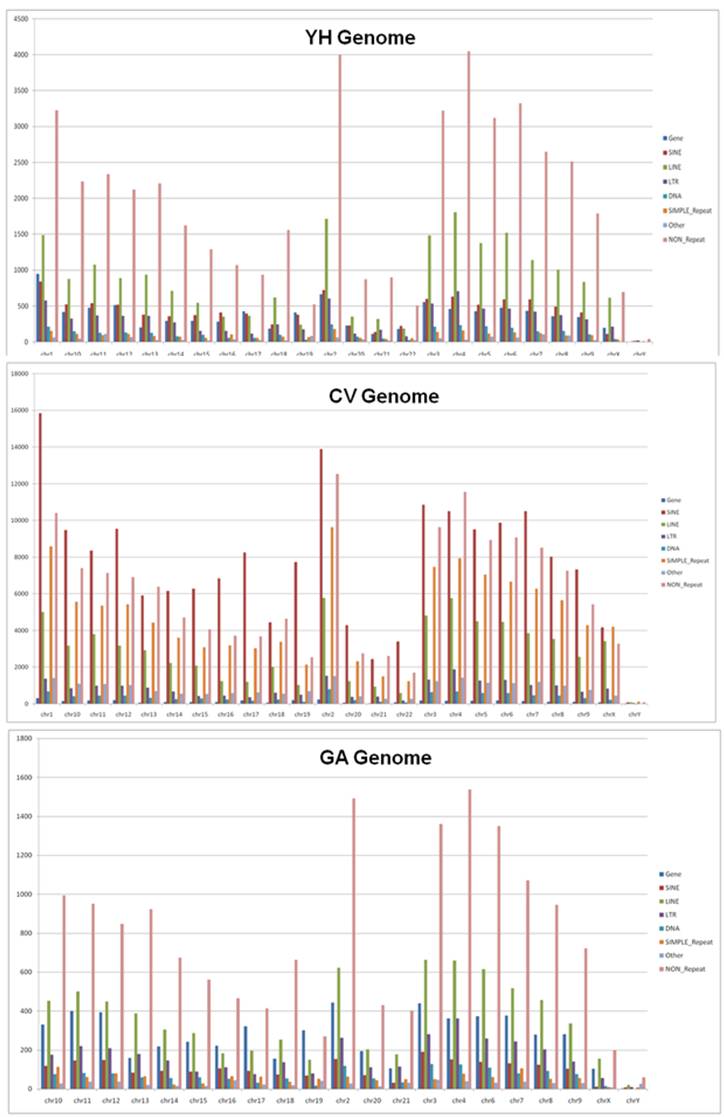
Figure xxx. Occurrence of InDels in the genes and repeat elements
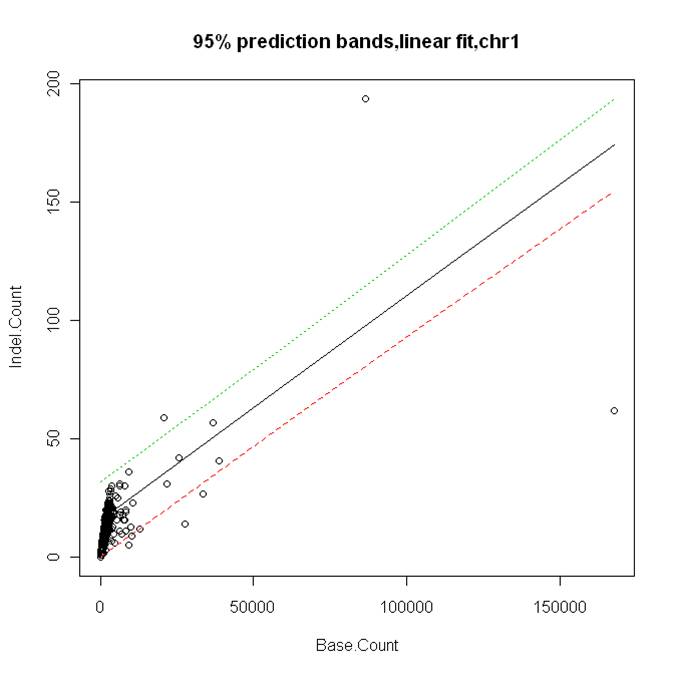
Figure xxx. InDel HotSpot
Talbe xxx. Mapping InDels to the Chimpanzee Genome and Identification of Specific InDel and Common InDels
|
Genome
|
Total InDel
|
InDel Human Specific Fragments Mapping
|
GA Vs YH , CV Common InDel
|
GA Specific InDel
|
YH Specific InDel
|
CV Specific InDel
|
|
YH Genome
|
135,199
|
1,488
|
102
|
260
|
1386
|
|
|
Venter Genome
|
559,473
|
25,407
|
76
|
286
|
|
25331
|
|
GaChon Genome
|
53868
|
362
|
|
|
|
|
3.4.3 Structural variations
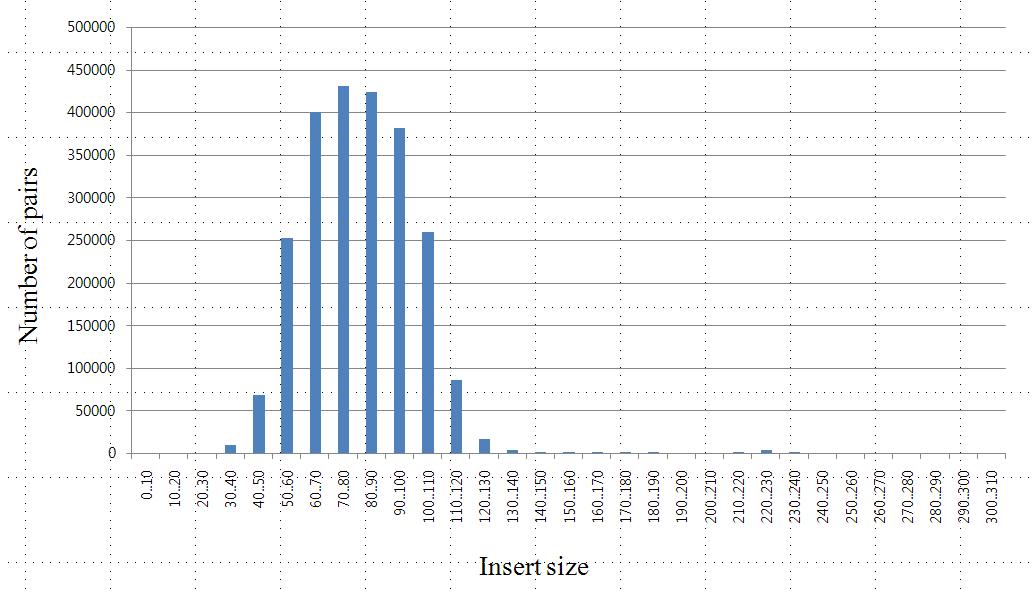
Fig X. Insert size distribution for pair-end libraries of KSJ.
.jpg)
Figx. Homozygous genomic region deletion in KSJ to the reference, detected by abnormal long insert sized read pairs compared to regularly insert size read pairs.
.jpg)
3.4.4 PCR-amplified resutls for validated SNPs, Indel, and CNVs
3.4.5 Gene related to non-synonmous SNP's
Non-Synonymous SNP's occuring in coding region have the higest impact on phenotype.We tested the non-synonymous SNPs for their possible effect on function and structure of proteins using Polyphen.Among the 4436 SNP's , 3477 (78%) were predicted as benign(no effect) while 602 (14%) were predicted as possibly damaging and 357(7.3 %) as probably damaging.These predictions were similar to Watson non-synonymous SNP analysis.Predictions were also made using SIFT (Seperating Intolerant From Tolerant) .Among 2589 SNP's sampled ,2092 (80%) were predicted to be tolerated while 477 (18%) as deleterious.
| Genome Project | Sampling | Probably damaging | Possibly damaging | Bening (No effect) |
| Korean Genome | 4436 | 357 (8 %) | 602 (14 %) | 3477 (78 %) |
| Watson Genome | 3898 | 7.3 % | 13 % | 74 % |
3.5 Genotypes and Phenotypes
3.6 Mitochondria analysis
3.6.1 Sequencing quality comparison based on MtDNA
The rCRS genome has accepted as a refercence genome for mitochondria.
We compaired the rCRS genome with KoRef mtDNA.
As the Table1, the two genomes has showed very similar in sequence composition.
Sequences of genes were aligned very clear (not appear stop codons). (figure 1)
미토콘드리아 DNA 데이터의 퀄리티를 확인하기 위해서 CRS 서열과 KoRef mtDNA 간의 서열 조성을 비교해보았다.(table 1)
Table 1. Comparison rCRS with KoRef mtDNA in sequence composition.
|
genome |
All |
A |
T |
G |
C |
AT% |
ATskew |
GCskew |
ATratio |
GCratio |
|
CRS |
16569 |
5124 |
4094 |
2169 |
5181 |
56 |
0.112 |
-0.41 |
1.252 |
0.419 |
|
Korean_MT |
16571 |
5113 |
4086 |
2180 |
5192 |
55.6 |
0.112 |
-0.405 |
1.251 |
0.42 |
보이는 바와 같이 두 서열에서의 ATGC 조성은 매우 비슷하게 나타남을 알 수 있다. 특히 solexa 실험에서 GC %가 퀄리티를 결정하는 중요한 요소로 확인하는 것으로 볼 때, 우리의 결과는 매우 신뢰성이 높음을 알 수 있다.
또한 CRS 지놈에 read들을 맵핑 시킨 결과를 바탕으로 KoRef consensus mtDNA를 만들어, 이 서열상에서의 유전자들을 prediction 했다. 이 prediction은 CRS 유전자 annotation 정보를 기반으로 비교하여 얻었다. Figure1과 table2에서 보여지는 바와 같이 미토콘드리아에서 존재하는 37개 유전자 모두가 끊김없이 clear하게 존재하는 것을 확인할 수 있었다.
13 mitochondrial protein coding genes, 12 rRNA genes, and 22 tRNA genes were identified by aligning with the rCRS mitochondrial genome sequences using Clustal W.
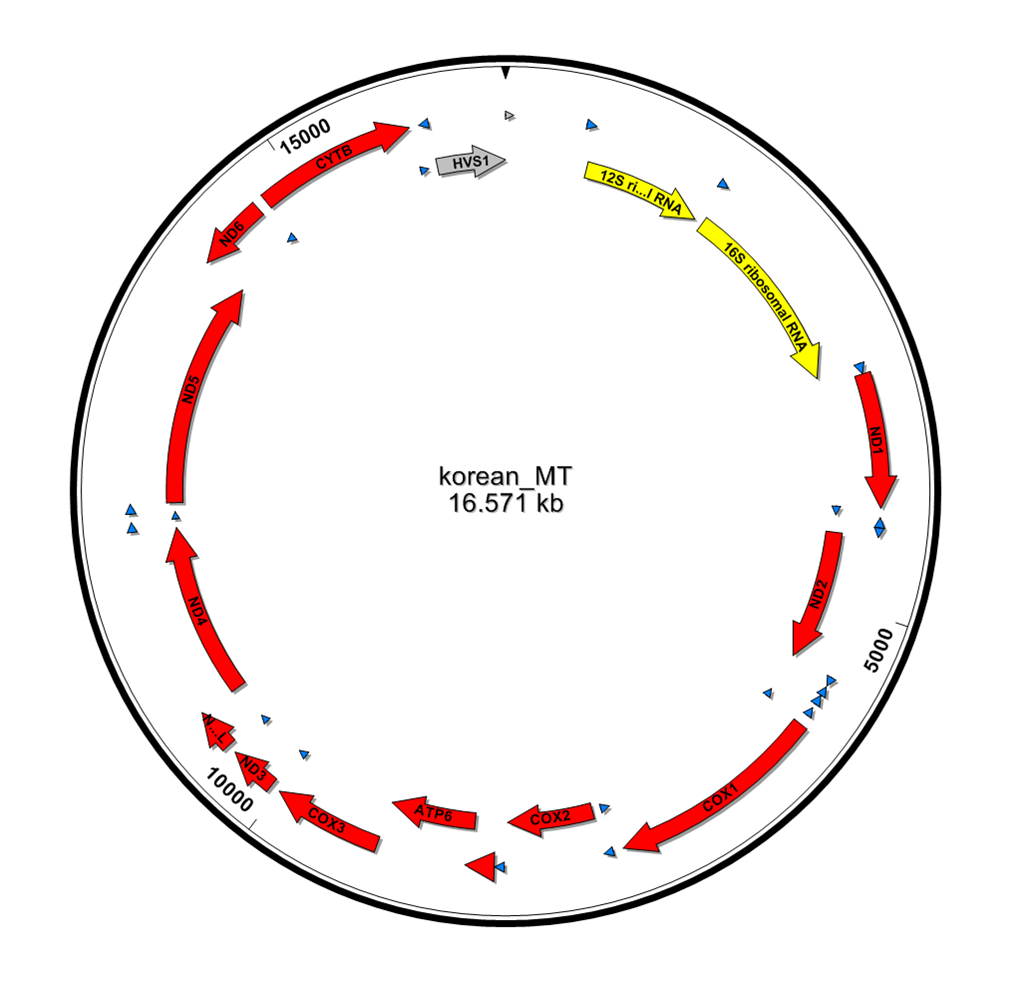
Figure 1. Annotation and visualization of KoRef mitochondria genome. Variations and genes of the genome were identified through sequence alignment against rCRS.
Table 2. Genes involved in KoRef mitochondria genome.
|
Gene Name |
start |
stop |
strand |
|
HVS2 |
1 |
57 |
|
|
tRNA-Phe |
579 |
649 |
plus |
|
12s_rRNA |
650 |
1603 |
plus |
|
tRNA-Val |
1604 |
1672 |
plus |
|
16s_rRNA |
1673 |
3230 |
plus |
|
tRNA-Leu |
3231 |
3305 |
plus |
|
ND1 |
3308 |
4264 |
plus |
|
tRNA-Ile |
4264 |
4332 |
plus |
|
tRNA-Gln |
4330 |
4401 |
minus |
|
tRNA-Met |
4403 |
4470 |
plus |
|
ND2 |
4471 |
5512 |
plus |
|
tRNA-Trp |
5513 |
5580 |
plus |
|
tRNA-Ala |
5588 |
5656 |
minus |
|
tRNA-Asn |
5658 |
5730 |
minus |
|
tRNA-Cys |
5762 |
5827 |
minus |
|
tRNA-Tyr |
5827 |
5892 |
minus |
|
COX1 |
5905 |
7446 |
plus |
|
tRNA-Ser |
7446 |
7517 |
minus |
|
tRNA-Asp |
7519 |
7586 |
plus |
|
COX2 |
7587 |
8270 |
plus |
|
tRNA-Lys |
8296 |
8365 |
plus |
|
ATP8 |
8367 |
8573 |
plus |
|
ATP6 |
8528 |
9208 |
plus |
|
COX3 |
9208 |
9991 |
plus |
|
tRNA-Gly |
9992 |
10059 |
plus |
|
ND3 |
10060 |
10405 |
plus |
|
tRNA-Arg |
10406 |
10470 |
plus |
|
ND4L |
10471 |
10767 |
plus |
|
ND4 |
10761 |
12138 |
plus |
|
tRNA-His |
12139 |
12207 |
plus |
|
tRNA-Ser2 |
12208 |
12266 |
plus |
|
tRNA-Leu2 |
12267 |
12337 |
plus |
|
ND5 |
12338 |
14149 |
plus |
|
ND6 |
14150 |
14674 |
minus |
|
tRNA-Glu |
14675 |
14743 |
minus |
|
CYTB |
14748 |
15888 |
plus |
|
tRNA-Thr |
15889 |
15954 |
plus |
|
tRNA-Pro |
15956 |
16024 |
minus |
|
HVS1 |
16025 |
16571 |
|
3.6.2 Variation aspect of mitochondrial genome
read들을 CRS에 맵핑 시킨 결과를 바탕으로 mtDNA에서 나타내어지는 SNP를 동정하였다. 모두 44건의 SNP를 찾을 수 있었으며, 그 중 insertion 3건과 deletion 1건을 찾을 수 있었다. 찾아진 SNP들은 앞에서 밝힌 유전자 정보를 바탕으로 annotation 하였다. 또한 단백질 코딩 영역에서 발견되어진 SNP에 대해서는 아미노산 변화 여부를 확인하였다. 그 결과로 6개의 non-synonymous가 발견되었다. (table3)
Table 3. Nucleotide substitutions in KoRef mtDNA against rCRS genome.
| # | Position | rCRS | KSJ | Class | Gene | Type | rCRS_aa | KSJ_aa | rCRS_nt | KSJ_nt |
| 1 | 73 | A | G | single | - | control_region | ||||
| 2 | 150 | C | T | single | - | control_region | ||||
| 3 | 195 | T | C | single | - | control_region | ||||
| 4 | 263 | A | G | single | - | control_region | ||||
| 5 | 310 | - | T | insertion | - | control_region | ||||
| 6 | 310 | T | C | single | - | control_region | ||||
| 7 | 311 | - | C | insertion | - | control_region | ||||
| 8 | 408 | T | A | single | - | control_region | ||||
| 9 | 750 | A | G | single | 12s_rRNA | rRNA | ||||
| 10 | 1438 | A | G | single | 12s_rRNA | rRNA | ||||
| 11 | 2352 | T | C | single | 16s_rRNA | rRNA | ||||
| 12 | 2483 | T | C | single | 16s_rRNA | rRNA | ||||
| 13 | 2706 | A | G | single | 16s_rRNA | rRNA | ||||
| 14 | 3107 | X | T | single | 16s_rRNA | rRNA | ||||
| 15 | 3109 | T | - | deletion | 16s_rRNA | rRNA | ||||
| 16 | 4769 | A | G | single | ND2 | synonymous | Met | Met | ATA | ATG |
| 17 | 5580 | T | C | single | tRNA-Trp | tRNA | ||||
| 18 | 7028 | C | T | single | COX1 | synonymous | Ala | Ala | GCC | GCT |
| 19 | 8701 | A | G | single | ATP6 | non-synonymous | Thr | Ala | ACC | GCC |
| 20 | 8860 | A | G | single | ATP6 | non-synonymous | Thr | Ala | ACA | GCA |
| 21 | 9377 | A | G | single | COX3 | synonymous | Trp | Trp | TGA | TGG |
| 22 | 9540 | T | C | single | COX3 | synonymous | Leu | Leu | TTA | CTA |
| 23 | 10398 | A | G | single | ND3 | non-synonymous | Thr | Ala | ACC | GCC |
| 24 | 10819 | A | G | single | ND4 | synonymous | Lys | Lys | AAA | AAG |
| 25 | 10873 | T | C | single | ND4 | synonymous | Pro | Pro | CCT | CCC |
| 26 | 11017 | T | C | single | ND4 | synonymous | Ser | Ser | AGT | AGC |
| 27 | 11719 | G | A | single | ND4 | synonymous | Gly | Gly | GGG | GGA |
| 28 | 11722 | T | C | single | ND4 | synonymous | Leu | Leu | CTT | CTC |
| 29 | 12705 | C | T | single | ND5 | synonymous | Ile | Ile | ATC | ATT |
| 30 | 12850 | A | G | single | ND5 | non-synonymous | Ile | Val | ATC | GTC |
| 31 | 14212 | T | C | single | ND6 | synonymous | Val | Val | GTA | GTG |
| 32 | 14580 | A | G | single | ND6 | synonymous | Leu | Leu | TTG | CTG |
| 33 | 14766 | C | T | single | CYTB | non-synonymous | Thr | Ile | ACT | ATT |
| 34 | 14905 | G | A | single | CYTB | synonymous | Met | Met | ATG | ATA |
| 35 | 15301 | G | A | single | CYTB | synonymous | Leu | Leu | TTG | TTA |
| 36 | 15326 | A | G | single | CYTB | non-synonymous | Thr | Ala | ACA | GCA |
| 37 | 15932 | T | C | single | tRNA-Thr | tRNA | ||||
| 38 | 16172 | T | C | single | HVS1 | control_region | ||||
| 39 | 16183 | A | C | single | HVS1 | control_region | ||||
| 40 | 16189 | T | C | single | HVS1 | control_region | ||||
| 41 | 16193 | - | C | insertion | HVS1 | control_region | ||||
| 42 | 16223 | C | T | single | HVS1 | control_region | ||||
| 43 | 16320 | C | T | single | HVS1 | control_region | ||||
| 44 | 16519 | T | C | single | HVS1 | control_region |
3.6.3 MtDNA ethno-genographic lineage
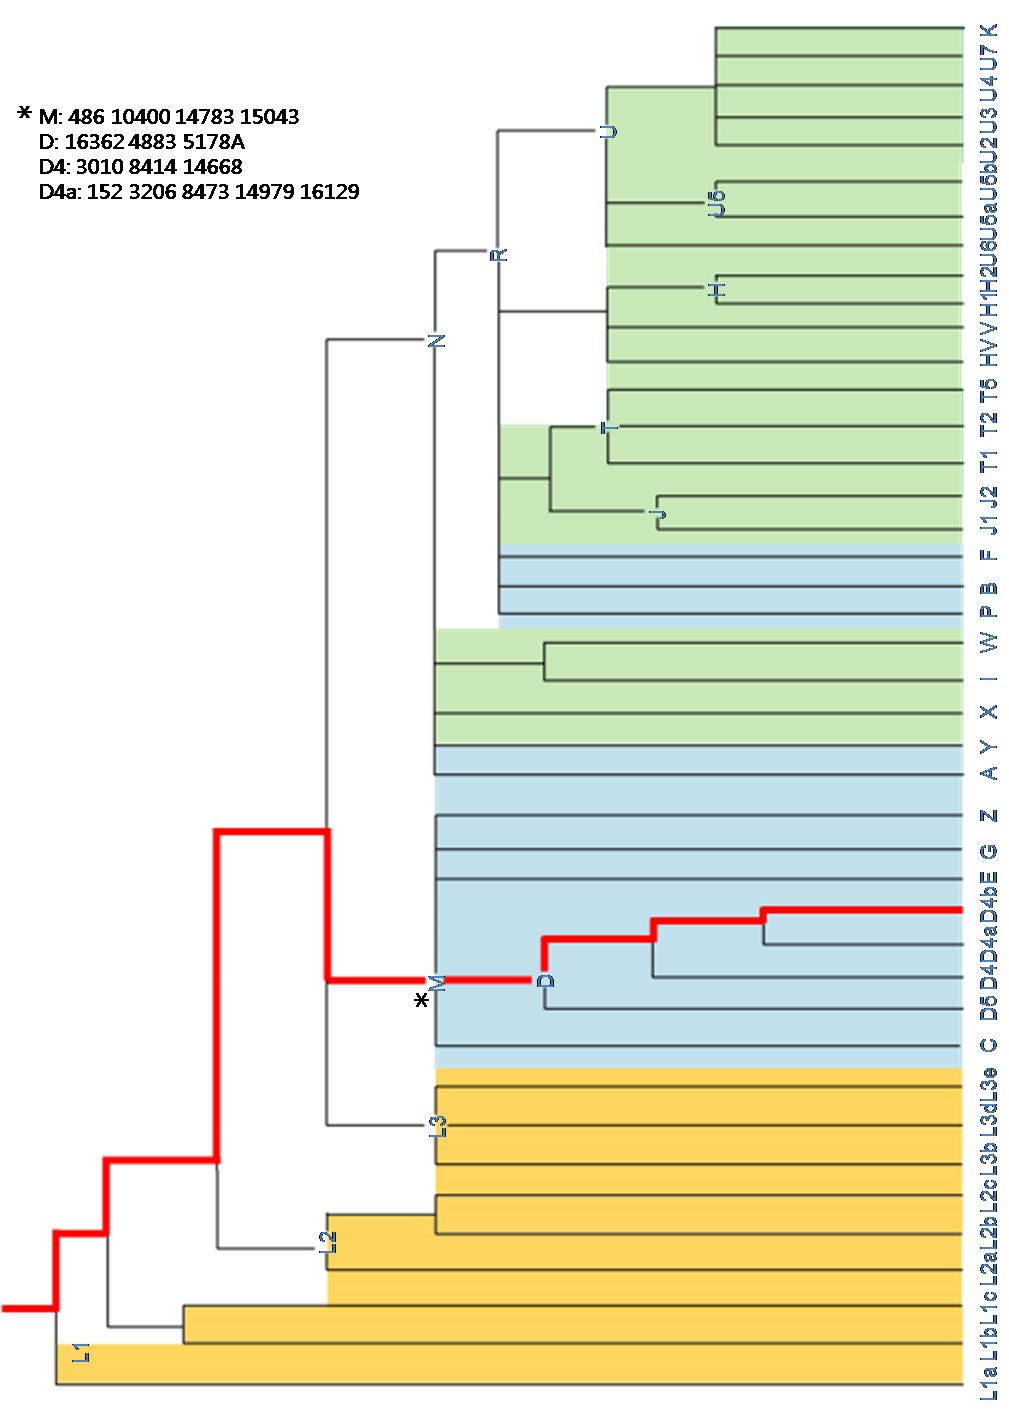
Fig XX. mtDNA ethno-genogeographic lineage
Korean mitochondrial DNA had on XX SNPs. According to 22 haplogroups defined by sequence differences from the rCRS, haplogroup D4, prevalent in Asia, mapping into our mtDNA.
3.6.4 Mapping disease information
We have been able to detect the expected phenotype based on the literature given the according to published literature (ref 1)
44개의 SNP들을 이용하여 질병 정보를 annotation 하였다. 그 결과 mtDNA의 1438번째 위치에 존재하는 SNP (A/G) 가 12S rRNA 유전자에서 diabetes Mellitus 에 맵핑되는 것을 확인 하였다.
Position: A1438G
Disease: Diabetes Mellitus
Gene: 12S rRNA
Reference: Tawata, M., Ohtaka, M., Iwase, E., Ikegishi, Y., Aida, K. and Onaya, T. (1998). "New mitochondrial DNA homoplasmic mutations associated with Japanese patients with type 2 diabetes." Diabetes 47(2):276-277.
Pubmed ID: 9519725
3.6.5 Heteroplasmy
possibility
- paternal inheritance (ref 2)
- by aging, MtDNA variation in one indivisual is increasing.
Observed heteroplasmy
10 =< MHP < 50% : 1
5 <= MHP < 10 : 8
1 <= MHP < 5 : 567
MHP: Minor-heteroplasmy
Table 4. Heteroplasmic mtDNA changes in KoRef mtDNA.
| Position | Nucleotide substitutions | Gene location: amino acid change | %heteroplasmy |
3.6.6 References
1. Tawata, M., Ohtaka, M., Iwase, E., Ikegishi, Y., Aida, K. and Onaya, T. (1998). "New mitochondrial DNA homoplasmic mutations associated with Japanese patients with type 2 diabetes." Diabetes 47(2):276-277. 9519725
2. Gustafson A. W., Heckerling P. S., Vissing J., Schwartz M. (2002). Paternal Inheritance of Mitochondrial DNA. N Engl J Med 347: 2081-2082
4. Material & Methods
4.1 Short read alignment
We aligned a fast short-read alginment program called MAQ. To sped up the alignment, MAQ only considers positions that have 2 or fewer mismatches in the first 28bp.
Sequences that fail to reach a mismatch score threshold but whose read pair in mapped are searched with a gapped alignment algorithm in the regions defined by the read pair.
MAQ always reports a single alignment, and if a read can be alinged equally well to multiple positions, MAQ will randmly pick one positions and give it a mapping quality zero.
MAQ usefully utilzes the read-pair information of paired reads.It is able to use this information to correct wrong alignments, to add confidence to correct alignments, and to accurately map a read to repetitive sequences if its mate is confidently aligned. With paired-end reads, MAQ also finds small indels from the gapped alignment described above. And, read pairs were aligned as abnormal long-inserted size if they had high-confidence alignments of each individual read.
4.2 Calling SNPs
MAQ produces a consensus genotype sequence from the alignment. The consensus sequence is inferred from a Bayesian statical model and each consensus genotype is associated with a Phred quality which measures the probability that the consensus genotype is incorrect. Potential SNPs are detected by comparing the consensus sequence to the NCBI reference and are further filtered by a set of predefined rules. These rules are:
1. Minimum 3 read depth (-d 3)
2. Filtering overestimate depth, randomly placed repetitive hits, had to be more than 100 (-D 100)
3. Consensus including SNP lower than Q20
4. Adjacent sequence lower than Q20
5. More 2 reads for supporting an allele of heterozygous SNPs
6. Remove SNPs within the 3bp flanking region around a potential indel4.3 Detection of small Indels
We called small indels (from 16 bp deletion to 7 bp insertion) by using paired-end indel detection mehtods of MAQ, requied at least three reads to support the indel, and add information confirmed by reads from both strands.
In any 20 bp window, if there are 2 or more Indels, discard them all. Finally, we classified homozygous indels by supporting less 10% about other allele.
5. Discussion
6. Supplementary information
7. References
Other information
댓글 0