Figure X. Comparision and overlap of SNPs of KSJ genome and other genomes. Watson, Venter, and BGI YH.
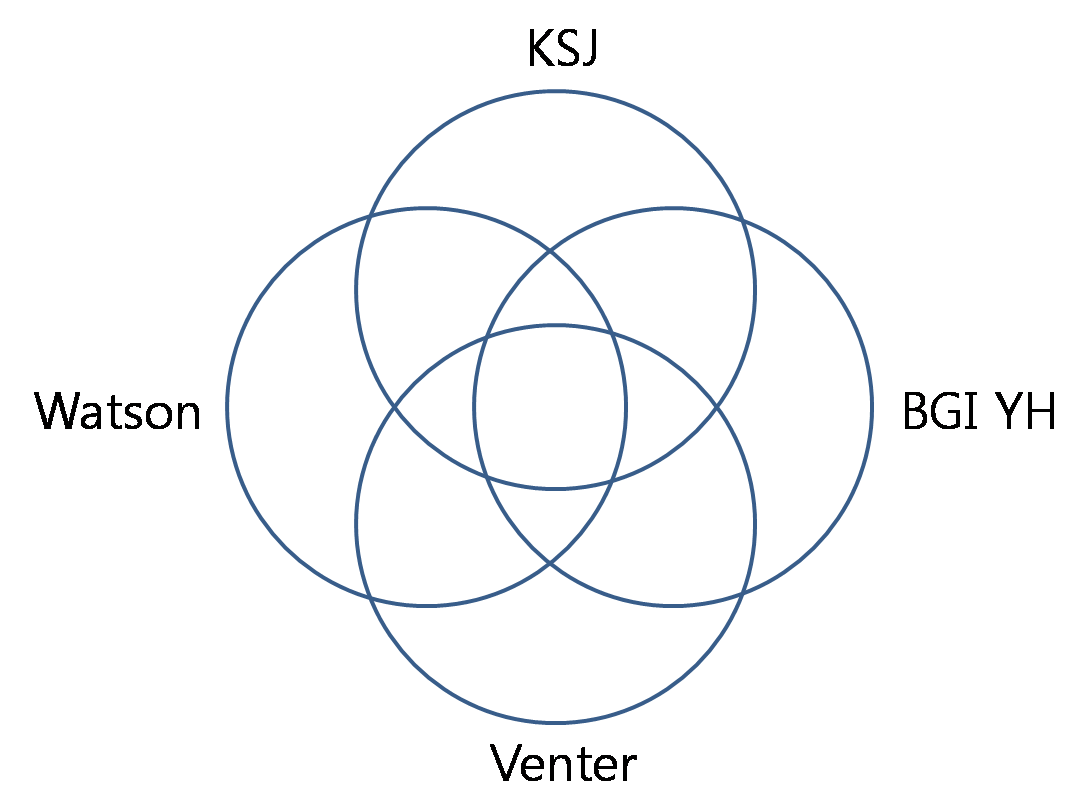
Figure X. Venn diagram of SNP comparison of KSJ genome with dbSNP and HapMap.
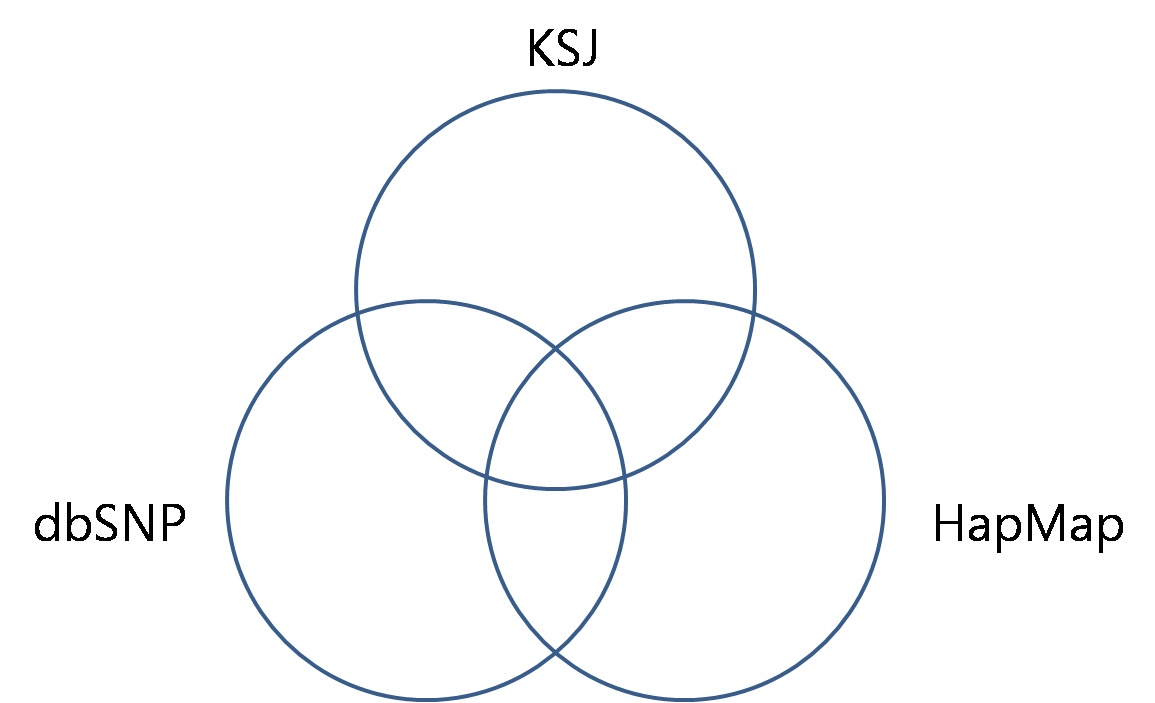
Figure X. Comparision and overlap of SNPs of KSJ genome and other genomes. Watson, Venter, and BGI YH.
Figure X. Venn diagram of SNP comparison of KSJ genome with dbSNP and HapMap.
댓글 0